As a responsible investor, we ensure job quality in line with the International Labour Organization (ILO) and the IFC Performance Standards, which cover the working conditions, wages, and health and safety of employees.
Employment within our portfolio
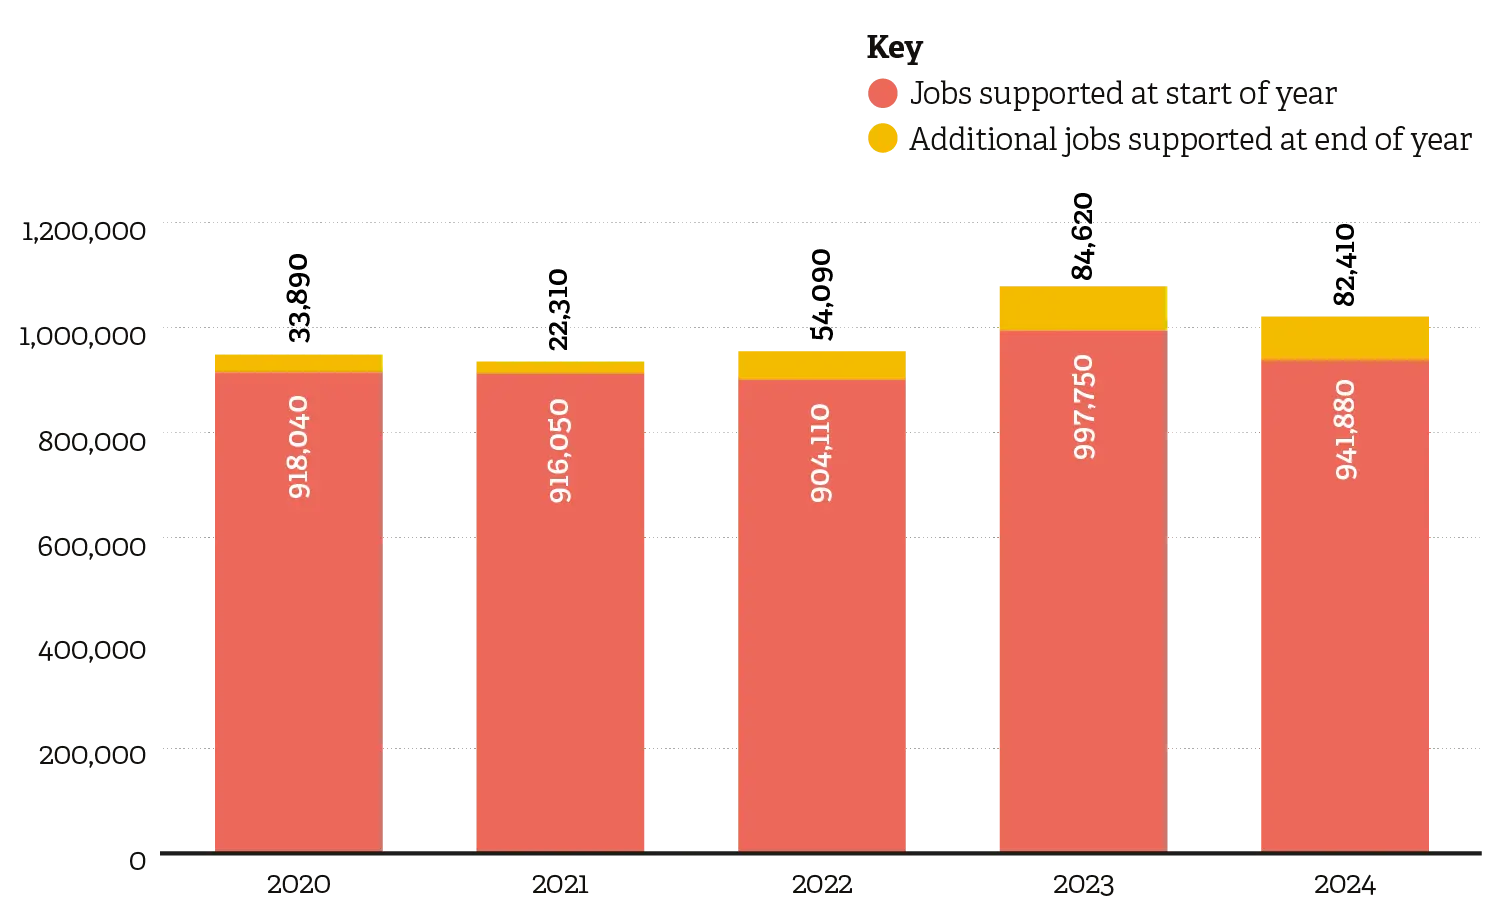
In 2024, our portfolio of businesses provided direct jobs for 1,024,290 people (in full-time equivalents). Of these, 357,810 are employed by businesses we back directly and 666,480 are employed by companies within the investment funds we have backed. The net increase in jobs in our portfolio was 82,410.
In addition, projects in our portfolio supported 6,865 temporary construction workers involved in building new assets.
Of the firms supported, 56 per cent are SMEs (under 300 employees) and 24 per cent are small businesses (under 50 employees).

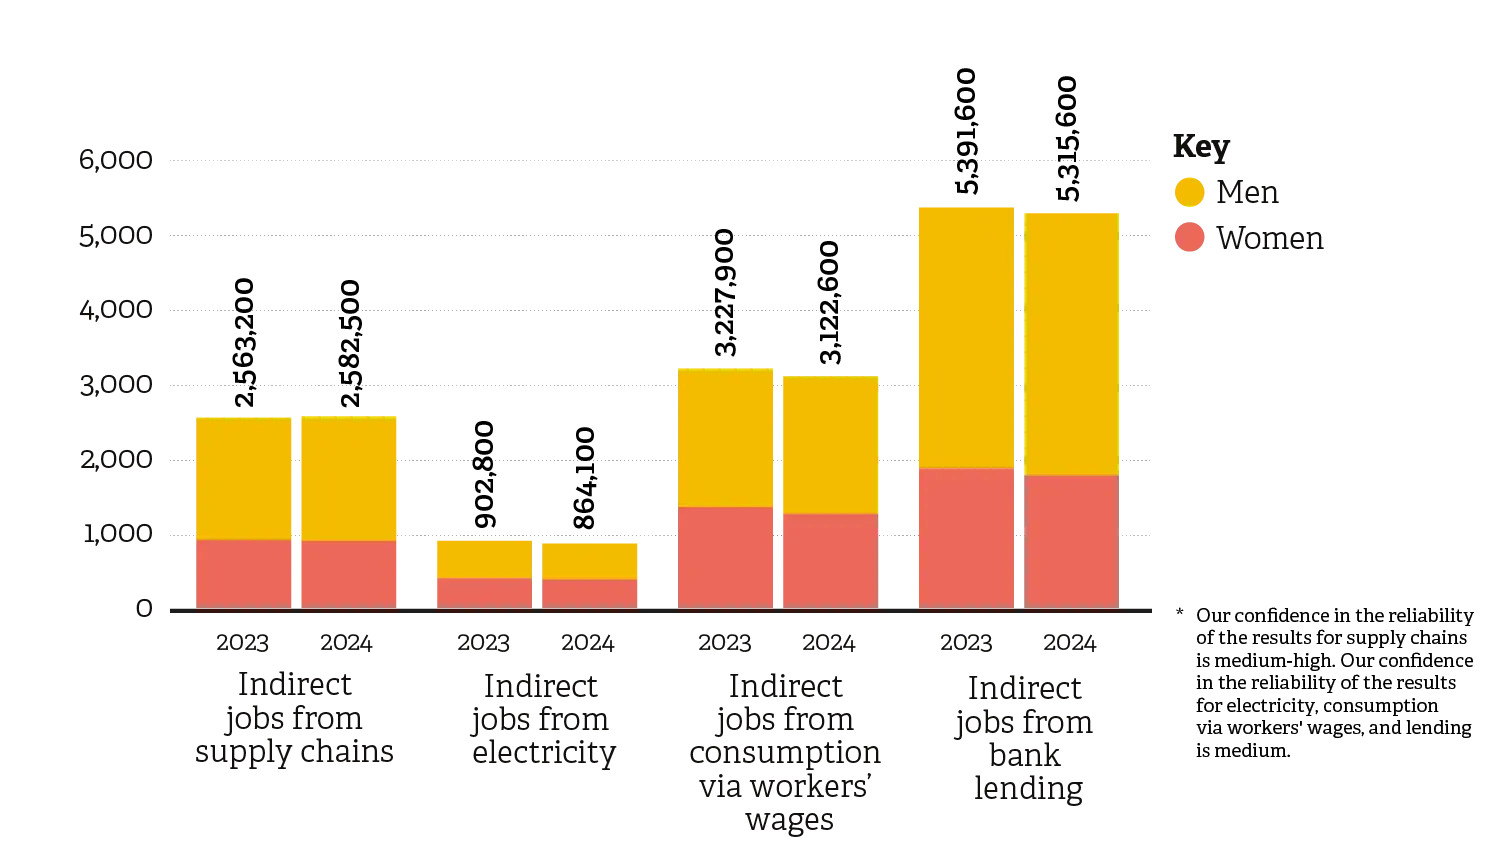


By improving access to electricity and finance, as well as supporting local wages and supply chains, the investments we make indirectly support many more businesses and livelihoods.”