Our investments

Investments

Whether transforming lives and markets or having a positive impact on the planet, our investments are making a difference while delivering a financial return for the UK taxpayer.

In this section we provide an overview of the commitments we made in 2024 to support emerging and developing economies, as well as both our financial and impact performance.

Our 2024 commitments
Download PDF(59 KB)
Backing key regions

For over a decade, we have focused our investment in Africa and South Asia. In 2024, a significant proportion of our commitments went to Africa.

Supporting priority sectors

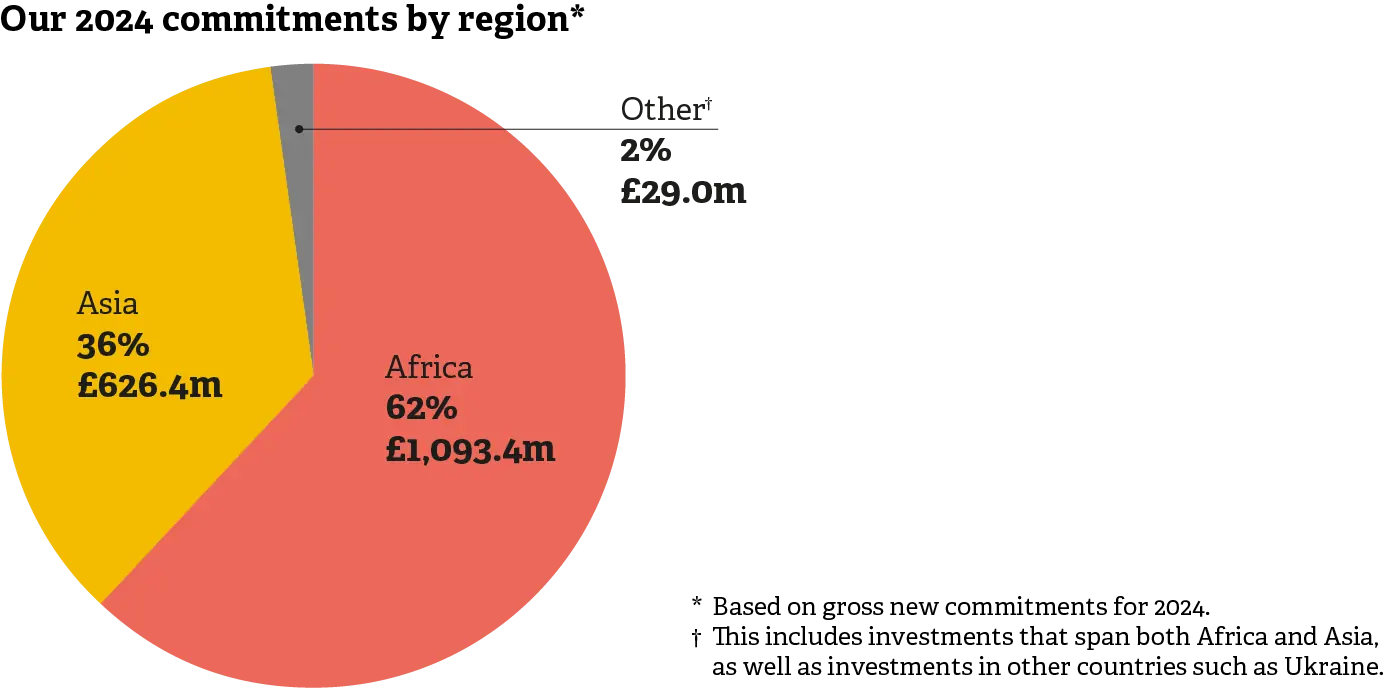
A focus on, and expertise in, key economic sectors is central to our approach to making successful investments. We prioritise those sectors that facilitate development and need our capital the most. Our priority sectors are those with the strongest potential to create the most jobs for the capital invested and contribute towards many of the UN's Sustainable Development Goals (SDGs). These sectors include financial institutions that direct capital to the people and enterprises that need it; the power infrastructure that will provide people with better access to electricity; sectors that are powerful job creators; and sectors critical to improving access to basic goods and services. This year, a significant proportion of our commitments went to financial services, driven by a number of trade finance and trade loan commitments.

A flexible approach to providing capital

We provide capital in many ways: direct equity, debt, intermediated investments (funds, for example), guarantees and trade finance. Each product has different benefits, so a flexible approach helps us achieve a wider range of impact objectives and meet the needs of each business. To effectively meet the needs of the markets where we invest, we run two investment portfolios: Catalyst and Growth. In addition, our Kinetic Portfolio enables us to manage concessional investment strategies, and we have a technical assistance and support facility, BII Plus.

Mobilising commercial capital into developing economies

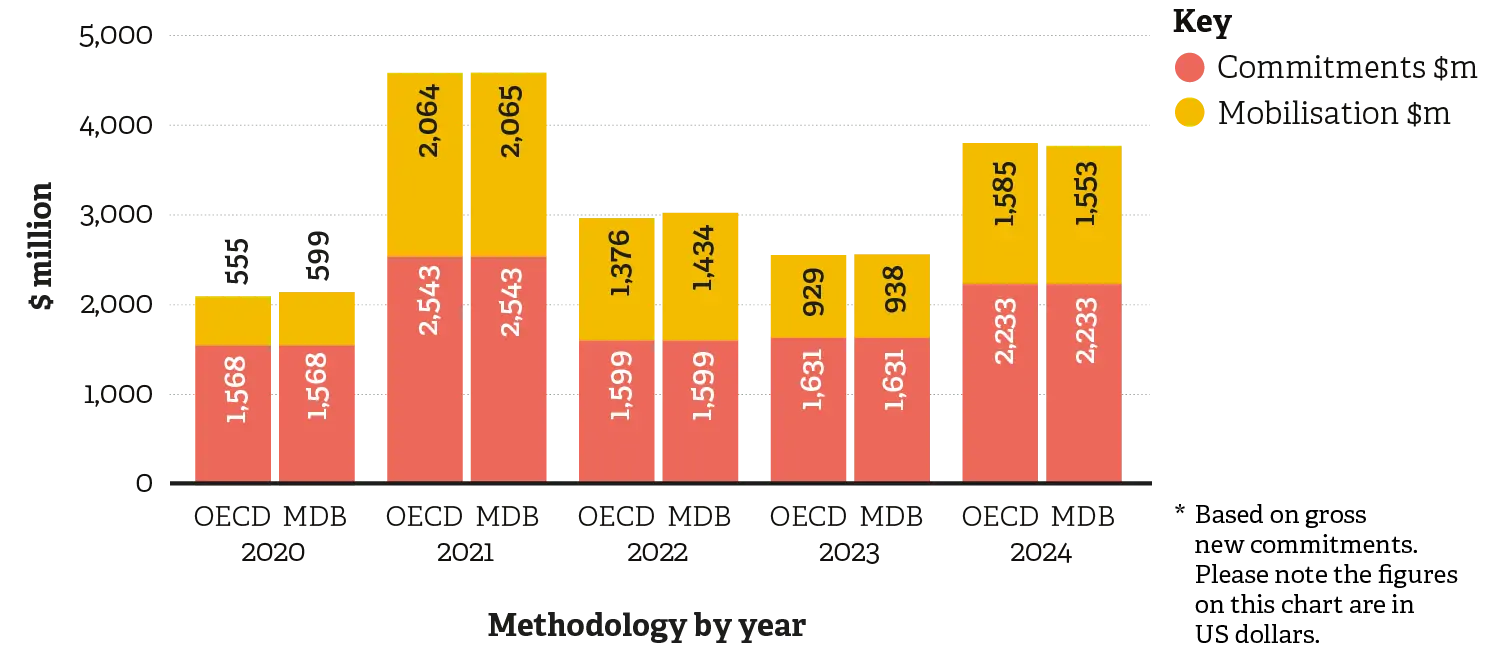
It is vital that DFIs encourage private sector capital to invest alongside them. In 2024, we made gross commitments of $2.23 billion and mobilised $1.55$1.59 billion of private sector capital into our investments. Using the Organisation for Economic Co-operation and Development (OECD) methodology, this meant mobilising $71 from the private sector for every $100 of our own commitments. And using the multilateral development bank (MDB) methodology, this meant mobilising $70 for every $100 of our own commitments.

Our financial performance

We invest to meet the needs of people and the planet in the markets we serve, while delivering a financial return for the UK taxpayer.

In 2024, we made £1.75 billion of gross new commitments, representing a 33 per cent increase from 2023 levels (£1.31 billion of commitments).

During the year, we reduced the size of some trade and supply chain finance facilities by £196.3 million, in line with use levels. Additionally, £27.5 million of commitments declared in 2023 were cancelled. Net new commitments were £1.53 billion, representing a 28 per cent increase from 2023 levels (£1.20 billion).

Our total net assets increased to £9.9 billion (£8.5 billion in 2023). Our overall portfolio fell by £28.4 million to £7.3 billion, with similar levels of new investments and realisations.

Our overall result is a profit after tax of £213.3 million (£44.0 million loss in 2023), which represents a gain of 2.5 per cent on net assets this year (0.5 per cent loss in 2023). The portfolio generated a return of £317.3 million (£71.5 million in 2023), which represents a portfolio gain of 4.3 per cent (1.1 per cent gain in 2023).

Total net assets
£9.9bn
Portfolio
£7.3bn
Gross amount committed in 2024
£1.75bn

Our overall result is a profit after tax of £213.3 million (£44.0 million loss in 2023), which represents a gain of 2.5 per cent on net assets this year (0.5 per cent loss in 2023). The portfolio generated a return of £317.3 million (£71.5 million in 2023), which represents a portfolio gain of 4.3 per cent (1.1 per cent gain in 2023).

We track portfolio return in US dollars, as most investments are denominated in this currency. That means our financial results can be significantly affected by changes in the sterling-to-US-dollar exchange rate. That was the case in 2024, where sterling depreciated during the year, causing a differential in sterling and US-dollar results.

In US-dollar terms, our portfolio generated a return of $299.1 million ($427.1 million in 2023), representing a gain of 3.3 per cent (5.2 per cent gain in 2023) as we saw positive performance across our markets.

We are a long-term investor, so it is important to look across several years for trends, recognising that, in any isolated year, market conditions or events may cause exceptional performance. Our financial performance measure, as defined in our 2022 – 26 strategy and 2022 – 26 Investment Policy, articulates our appetite for financial risk and return, as well as ensuring the proper stewardship of taxpayer-owned assets. Our performance is assessed based on a minimum return of 2 per cent across our total portfolio, measured on a rolling seven-year basis. This measure is consistent with our mandate to invest to meet the needs of people and the planet in the markets we serve, while ensuring our own long-term financial sustainability.

We remain ahead of this financial return hurdle, and the seven-year weighted average annual portfolio return is currently 5.1 per cent, as shown in the chart below.

Portfolio return (%)
Chart

Our impact performance

We invest to make a lasting difference to people and the planet. This is shown through our commitment to the UN’s SDGs. 

We target a wide range of global issues set out in the goals, beginning with Goal 1 on poverty, along with others such as promoting economic growth, creating more and better jobs (SDG 8); access to goods and services such as power infrastructure and telecommunications (SDGs 7 and 9); gender equality (SDG 5); and climate action (SDG 13). Illustrated below are the three SDGs that received the largest capital commitments from us in 2024, along with the corresponding commitment values.

Chart

View a full breakdown of our commitments to the SDGs

Our overall approach ensures we meet the Operating Principles for Impact Management, which form the international standard for impact management. We have also been included in BlueMark’s 2025 Practice Leaderboard, which was introduced to highlight impact investors with best-in-class impact management practices.

How we calculate our Impact Score

Our Impact Score is designed to recognise and incentivise investments that are likely to contribute most to our three strategic impact objectives of productive, sustainable and inclusive development.

We give every potential investment a score for each of these three objectives and then calculate an overall investment score. We combine individual scores to create an aggregate Impact Score for our portfolio.

Find out more about how we calculate the Impact Score for each investment 

Our Impact Score is just one part of our overall approach to impact.

Find out more about our impact approach

Our Impact Score performance

In 2024, our aggregate Impact Score was 7.0. This is based on the expected impact of our new commitments and the impact delivered by our portfolio. Our aggregate Impact Score, and the process we use to score individual investments, are externally assured by an independent third party using international standards. This means a third party has reviewed the scoring process and tested a sample of investments to increase our confidence that we have implemented the tool in line with our processes and procedures.

You can read the assurance statement on our website

A core part of our approach to impact management is our evaluations programme.

These evaluations evidence the impact of our investments on people and the planet using innovative, rigorous research and evaluation methods. We work with the FCDO to commission independent evaluations of our investments as part of the Evaluations and Learning Programme, alongside BII-funded studies.

In 2024, our studies helped us learn about our impact performance in several areas. These included the following:

We strive to ensure that evaluations and research are at the heart of how we make decisions and drive impact. All our evaluations can be found on the How we learn page of our website.

Privacy Overview

This website uses cookies so that we can provide you with the best user experience possible. Cookie information is stored in your browser and performs functions such as recognising you when you return to our website and helping our team to understand which sections of the website you find most interesting and useful.

Strictly Necessary Cookies

Strictly Necessary Cookie should be enabled at all times so that we can save your preferences for cookie settings.

If you disable this cookie, we will not be able to save your preferences. This means that every time you visit this website you will need to enable or disable cookies again.

Analytics Cookies

This website uses Google Analytics to collect anonymous information such as the number of visitors to the site, and the most popular pages.

Enabling these cookies helps us to improve our website.